When conducting thermal inspections thermographers are faced with making a choice of which palette to use.
Why are there so many choices?
What do different palettes do?
Does it really matter?
Here we try to take the mystery out of palette selection.
First, a note on what a palette really is. A palette is simply the software’s colourful rendering of the radiometric data provided by the thermal camera. The sensor captures raw, mathematical data for every single pixel. It doesn’t see colour, it sees 15°C, or 25°C. What it does is tell the software, for every pixel that is 15°C, paint it blue to show it is colder. For every pixel that is 25°C, paint it red to show it is warmer.
Think about it this way. The thermal camera is the scientist collecting the data. The software is the artist telling the story.
A second important point is that, while your flight is limited by the number of palettes available in your drone, or thermal camera, many software programs such as DJI’s Thermal Analysis Tool (10) and Thermogram (24) offer more during processing. Some can also produce custom palettes. So, what you see during flight may be limited by your drone, but what you can customize and produce is nearly limitless.
While there are many palettes available, I categorize them into three broad buckets because my job is to know which image will make your specific issue the easiest to see.
1) “Context” Palettes (White Hot/Black Hot)
Best Use is for general navigation and structural outlines.
Why? These look the most like “normal” photos. I use these to show a client where we are looking so they don’t get lost in the colours.
2) “Anomaly” Palettes (Iron Red/Hot Iron)
Best Use is for spotting heat leaks, electrical “hot spots”, or mechanical friction.
Why? These make high temperature differences “pop” against a dark background.
3) “Biological” Palettes (Rainbow/Arctic/Medical)
Best Use is for agriculture, turf health, and moisture detection.
Why? These are designed for fine gradients. When the temperature difference is only 1°C or 2°C (like a thirsty patch of grass vs. a hydrated one), these palettes reveal the subtle patterns that grayscale would miss.
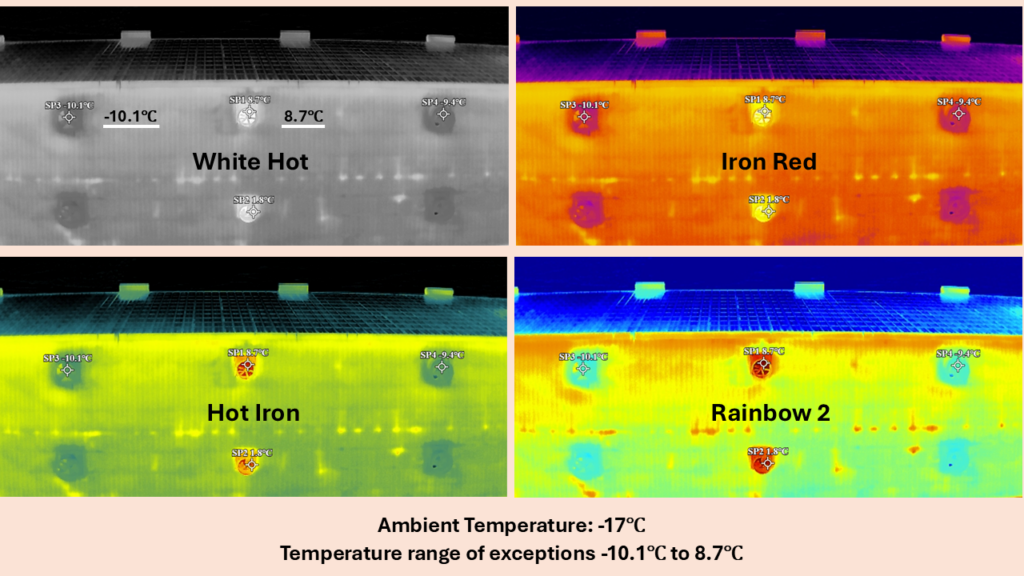
(Spot temperatures are labelled on White Hot; the same points apply to all four palettes)
While these may be “Best Use” cases, by no means is the use as prescriptive as my buckets might suggest. Because palettes are where the science of thermography meets the art. You can see the Rainbow 2 palette provides quite a unique presentation of the thermal patterns emitted by this structure. The final decision rests with you, the thermographer. Choose the palette you believe best delivers the information you want to deliver to your client for that specific job. And it may very well change for your next one!